

Resonance on a real harsh vocal: what the tone tests missed
A lab note. Measured 14 November 2026 on the version of Resonance in development at the time.
We tuned Resonance on test signals: one tone over noise, at many levels and frequencies. On those, its cuts landed where they should. Then we ran it on a genuinely harsh real vocal, and it didn't.
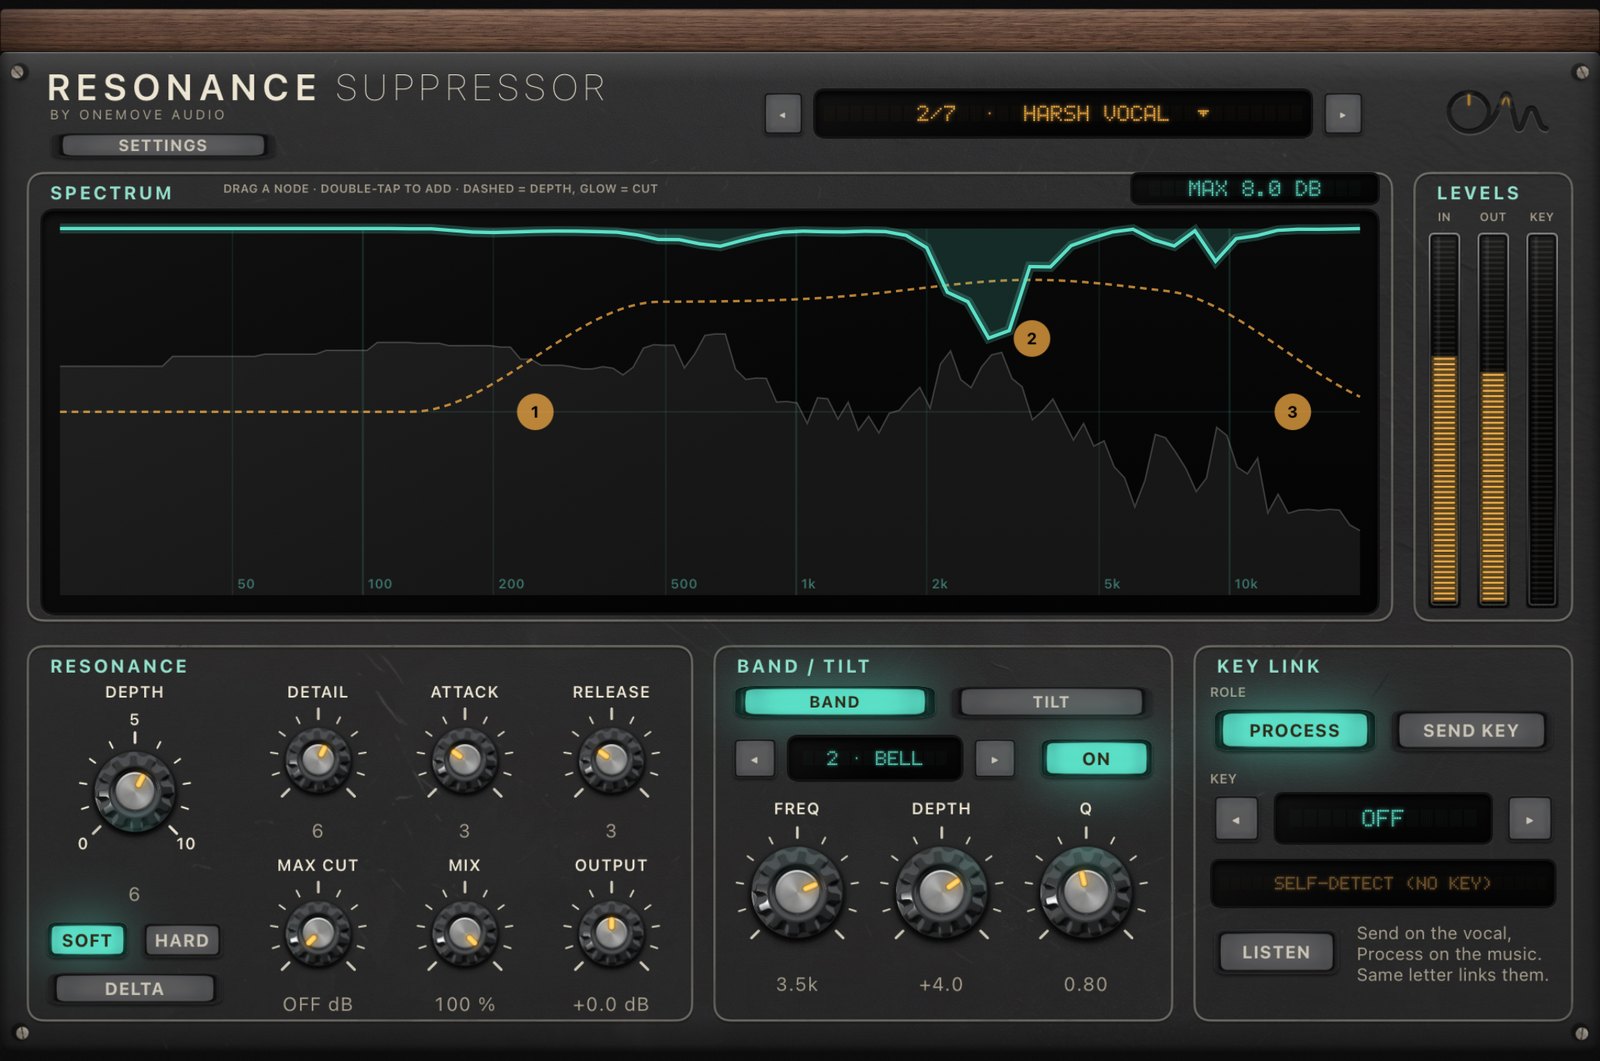
The test
- Vocal: a dry, bright, shouted chorus, 30 seconds at 48 kHz ("Stayin' at Home – Vocals" by mindmapthat, CC BY 3.0).
- Method: each render is compared with the dry vocal, band by band: how much energy each band lost over the whole excerpt. Black-box: audio in, audio out.
What we found
| render | 200–500 Hz | 1–2 kHz | 2–3 kHz | 3–4 kHz | 7–10 kHz | spread |
|---|---|---|---|---|---|---|
| Resonance, default, Depth 5 | −0.9 | −1.0 | −1.0 | −1.1 | −1.1 | 0.3 dB |
| Resonance, default, Depth 10 | −2.4 | −2.4 | −2.4 | −2.4 | −2.4 | 0.6 dB |
| Resonance, Harsh Vocal preset, Depth 10 | −2.6 | −3.8 | −3.4 | −3.6 | −3.7 | 1.2 dB |
- Default, Depth 5
- Default, Depth 10
- Harsh Vocal preset, Depth 10
The values (dB)
| 200–500 Hz | 1–2 kHz | 2–3 kHz | 3–4 kHz | 7–10 kHz | |
|---|---|---|---|---|---|
| Default, Depth 5 | -0.9 | -1.0 | -1.0 | -1.1 | -1.1 |
| Default, Depth 10 | -2.4 | -2.4 | -2.4 | -2.4 | -2.4 |
| Harsh Vocal preset, Depth 10 | -2.6 | -3.8 | -3.4 | -3.6 | -3.7 |
"Spread" is the difference between the most-cut and the least-cut band: how selective the cut is. On this vocal the harshness is typically at the 2–4 kHz edge and the 7–10 kHz sizzle, so a de-harshing cut should be deepest there. Resonance cut about the same amount everywhere (a spread of 0.3–1.2 dB), which is a gentle level drop rather than de-harshing.
Why
On a single tone, there is one peak to find. On a sung note, every harmonic stands above its surroundings, from the bass to the top. Resonance measured each peak against an average taken over a narrow window, so it found "resonances" everywhere and cut them all a little.
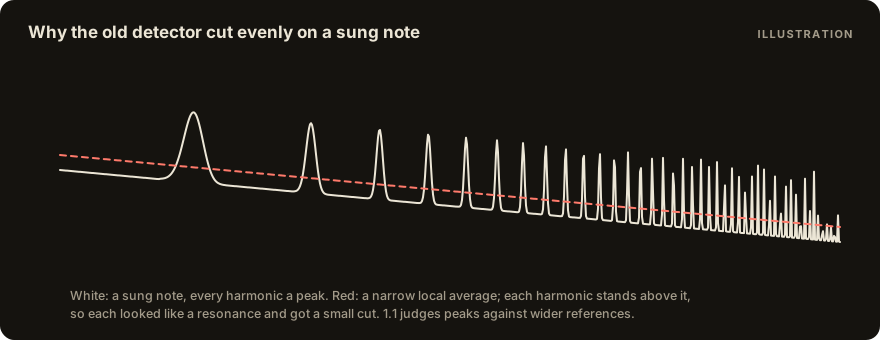
What we changed
- The test set: real vocals are now part of every fit, with held-out singers that are never fitted on, and a pass bar per measure. The same check now runs on every Vocal Console module.
- Resonance itself was rebuilt for version 1.1 to judge each peak against wider references that a voice's harmonics don't stand out from, so its cut now gathers where a vocal is harsh instead of spreading evenly. The cut is the same at 0 dB and −20 dB input to within 0.05 dB. Measured on the 1.1 build of 14 November 2026. You can hear it on real vocals in the listening comparison.
Measured on 14 November 2026.